The mountain calls –
the satellite responds
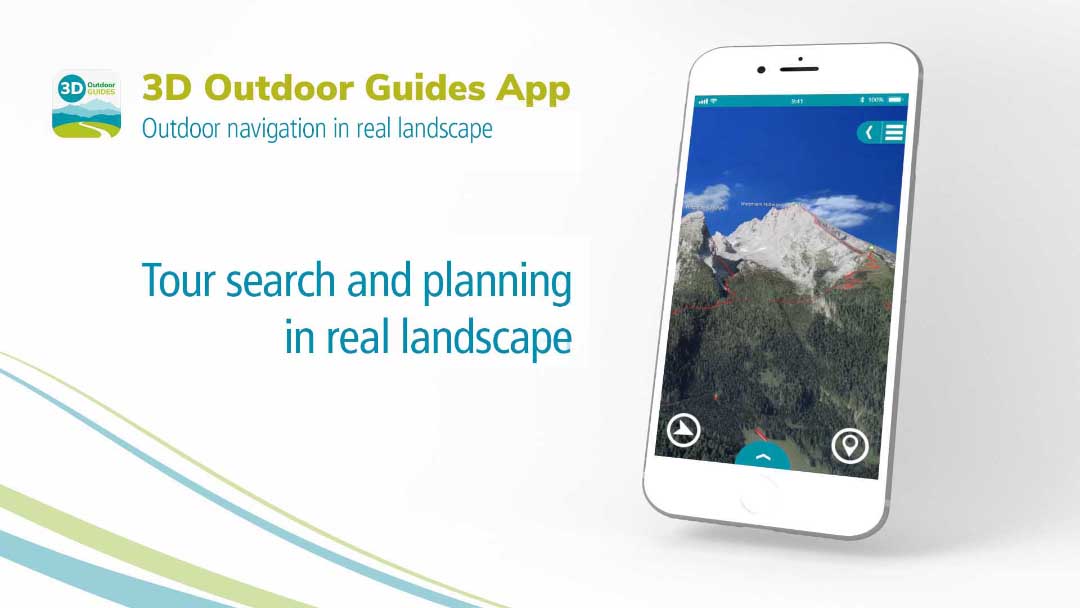
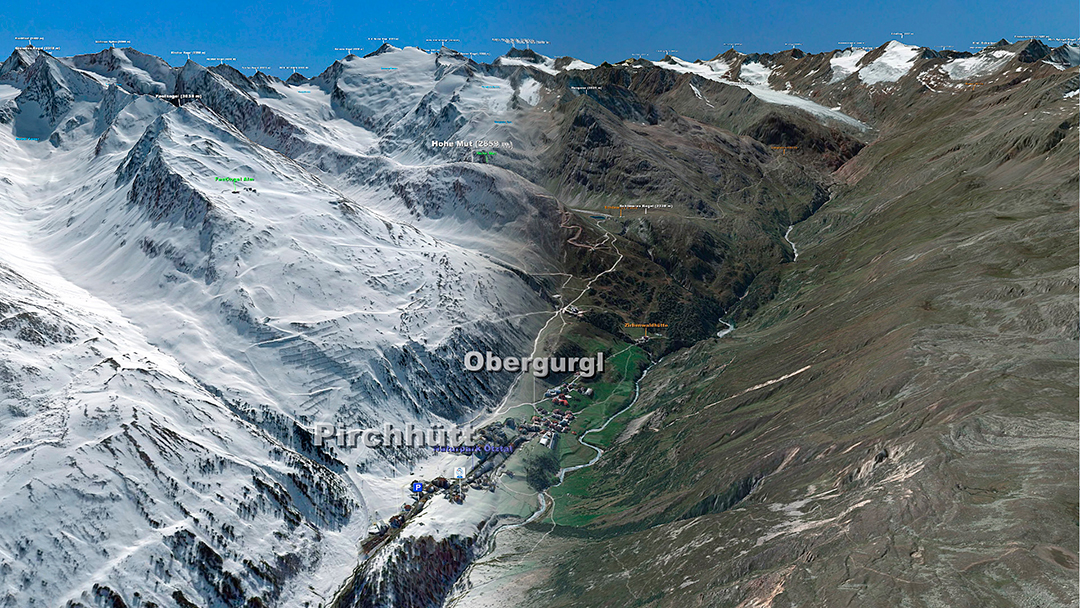
Nearly as beautiful as being there:
3D maps for alpinists
© 3D RealityMaps – www.realitymaps.de
Off to the mountains. But where are the best hiking routes, skiing regions, or mountain bike tours? And how are things on the spot? What is the height profile of a tour, are the inclines not too steep?
Previously the task was to decipher existing hiking maps with the expert’s eye without overlooking details. To derive the correct conclusions on
the respective incline from the contour lines. Or to go there and see for
oneself – hit or miss.
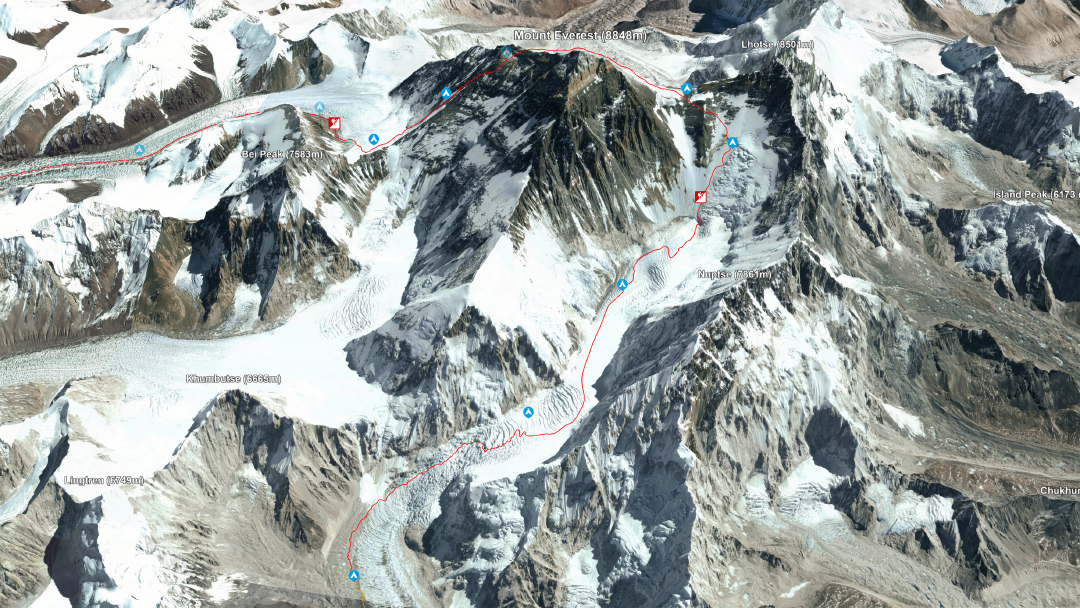
Now Earth observation by satellites lays the foundation for better “deciphering” of mountains, i.e. with 3D maps and 3D apps, not
only used by mountaineers.

© 3D RealityMaps GmbH
© 3D RealityMaps GmbH
© 3D RealityMaps GmbH
© DELPHI InformationsMusterManagement GmbH
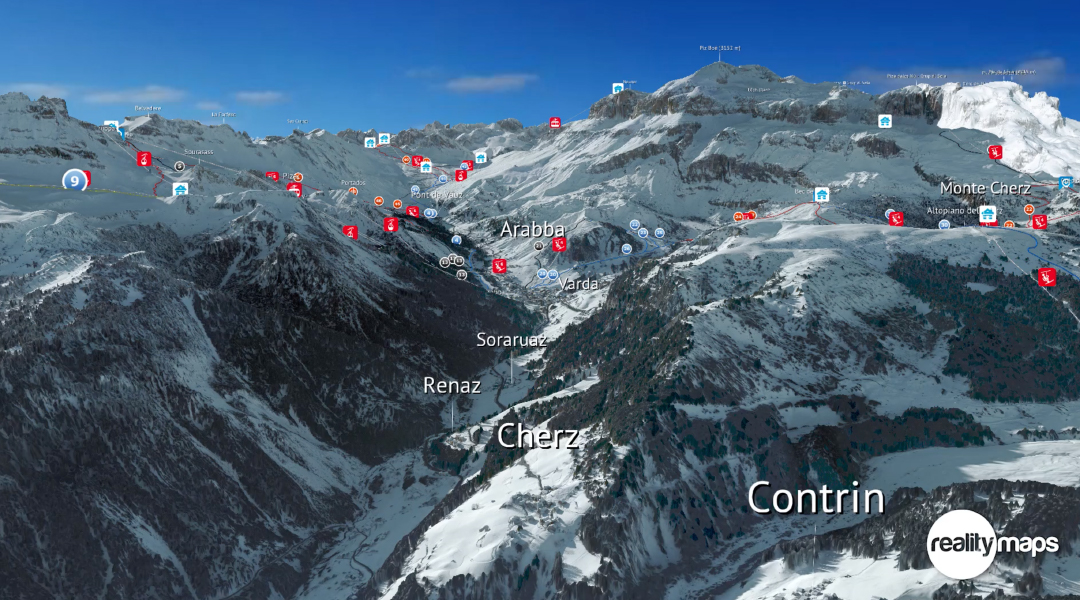
Is the winter trip worth it?
Is there any snow?
© 3D RealityMaps – www.realitymaps.de
Snow heights are traditionally measured with a metre stick – or more
state-of-the-art with a firmly installed snow height sensor. Both methods are
very precise; however, they are nothing but spot tests. Even snowdrifts
may result in false measuring results. Especially the monitoring of snow
height trends – important for travel planning and in particular for climate
research – continuously requires reliable data on large regions or all over the
world to detect long-term changes based on time series.
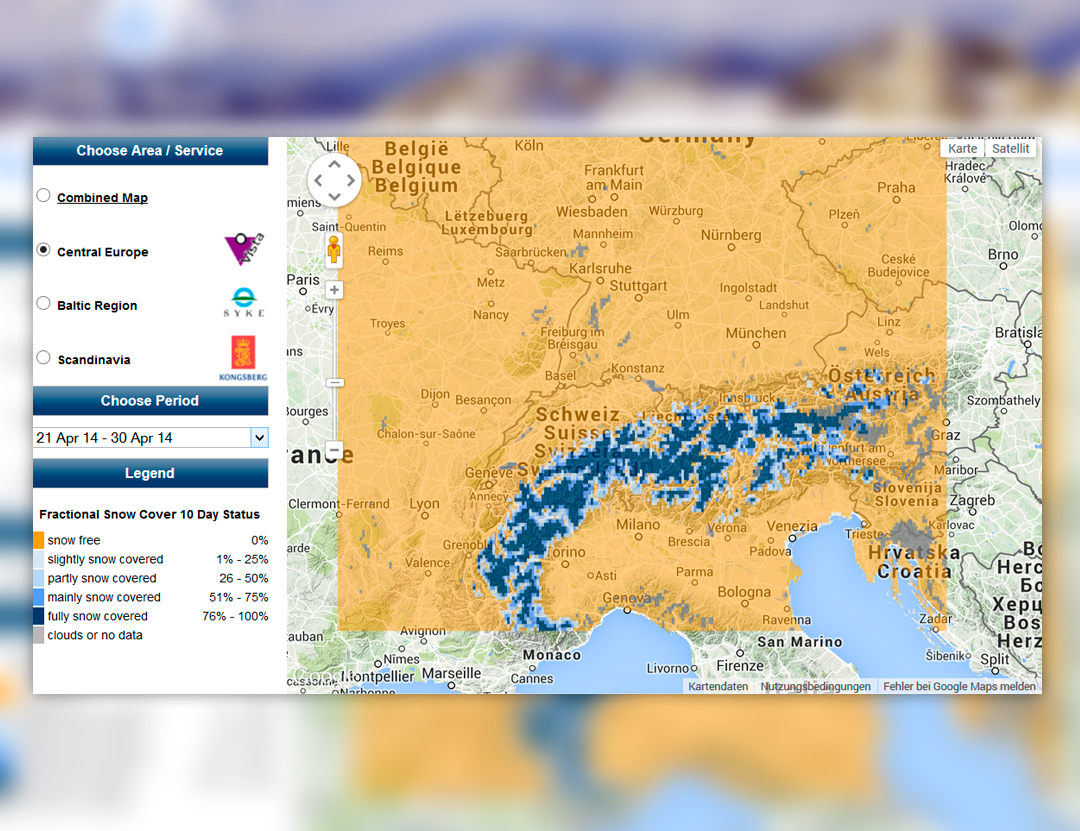
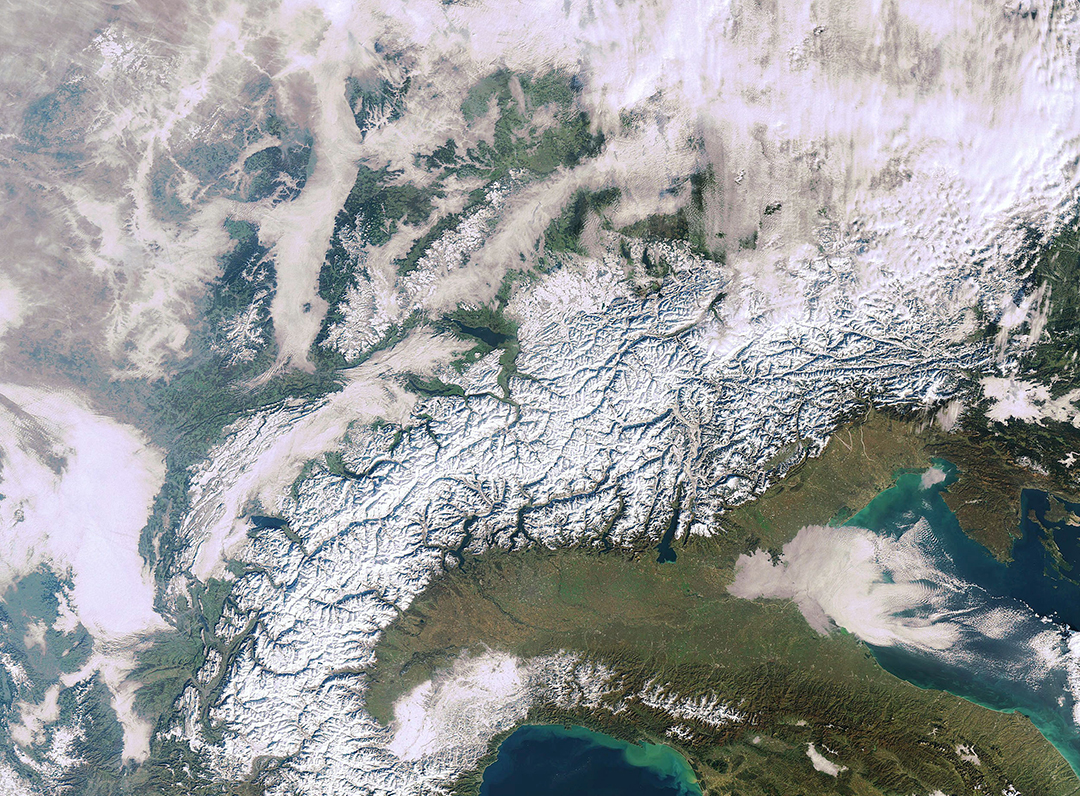
With technically sophisticated combinations of optical, temperature and
radar data from space – and the suitable mathematical models – meteorologists can measure the extension of snow and ice surfaces as well as their changes in order to draw up a world map of snow coverage, for example – even where nobody measures the snow parameters (for instance type and age of snow), like in Siberia or the Tibetan high plateau.
The data for this purpose is provided, for example, by the instruments on board the Sentinel satellites of ESA’s Copernicus programme. In addition, this data enables supporting large-scale snow situation reports and forecasts for winter athletes.
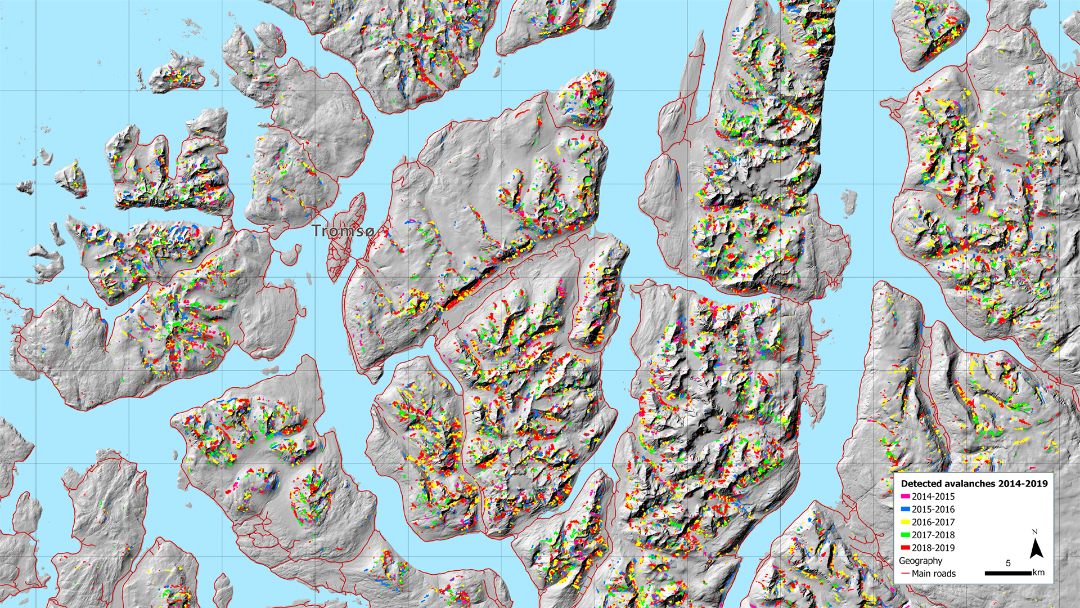
© Eckerstorfer, Malnes, Vickers & Grahn, 2019 eller Eckerstorfer et al, 2019: Snow avalanche activity detected using Sentinel-1 data in Northern Norway (2014-2019). NORCE
© Vista GmbH (2015)

Technology from outer space: 3D images, first on Mars, subsequently on Earth
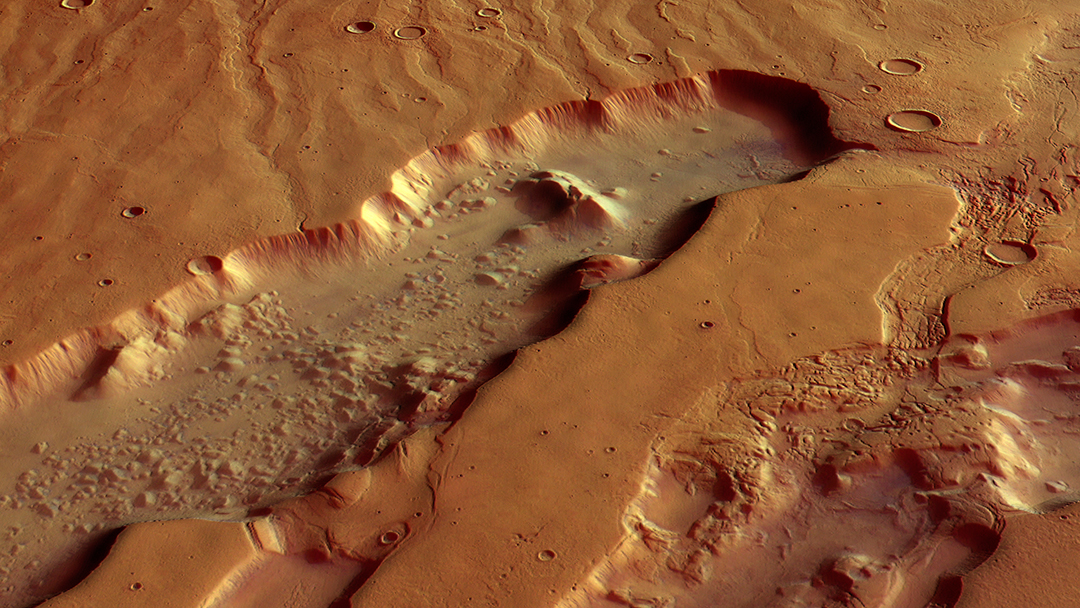
© ESA/DLR/FU Berlin
The basics for 3D visualisation of the Earth’s surface have emerged from DLR’s space research. Initially, the task was to map Mars (using the high-resolution stereo camera HRSC developed by the DLR Institute of Planetary Research). If the climate there was more convenient, and the trip was not that elaborate, Mars would be a paradise for alpinists. Take the mountain “Olympus Mons” alone. With a height of 26,000 metres, it is the highest mountain of our solar system. However: there is no beautiful summit, which seems to be rather flat despite of its height due to its diameter of 600 kilometres.
A novel procedure for 3D processing of stereo images has been developed at DLR’s Institute of Robotics and Mechatronics. 3D RealityMaps GmbH participated in the development as an industry partner.
The technology:
detecting ice and snow from space
© ESA
Humans can easily recognise snow with their eyes. And so can satellites – but more precisely. Certain kinds of snow and ice, such as glacier ice, for example, reflect the light in the infrared range as well. By superposition and evaluation of satellite images taken in small wavelength ranges of light, software is capable of recognising what is snow, what is corn snow, and what is glacier ice. This enables automated monitoring of glaciers or, unfortunately, mostly their shrinking and disappearing caused by global warming, respectively. With data from the Sentinel satellites, today snow detection is possible.
From 2023, the detection will further improve: with the instrument METImage, some kind of camera. It has been designed mainly for capturing clouds; however, it is also capable of detecting ice and snow.
METImage is a multi-spectral, imaging radiometer, developed by
Airbus Defence and Space on behalf of the DLR. It will be carried on board a weather satellite (EUMETSAT Polar System – Second Generation). In
20 spectral channels at the same time and at a resolution of 500 metres, METImage will capture a band with a width of 2,670 kilometres, providing, among other things, important information on clouds, cloud coverage, and land surfaces, as well as on ocean, ice, and land surface temperatures. In this way, weather and climate forecasts will arrive at a new quality level.
Other satellites also provide data regarding the monitoring of snow and ice:
- TanDEM-X: volume and mass changes of glaciers and ice caps
- GRACE, GRACE-FO: imminent mass changes of glaciers and ice caps
- Sentinel-1 and -2, TerraSAR-X and TanDEM-X: expansion and flow speed of glaciers
- Sentinel-1 and -2: expansion and movement snow fields
- Sentinel-3: measuring of elevation (and monitoring of changes in thickness) of glaciers and icebergs
- Sentinel-1, TerraSAR-X and TanDEM-X: grounding lines of shelf ice
- CryoSat-2: changes in height, sea ice expansion, and thickness
You don’t feel like snow anymore? Satellites can also detect spring
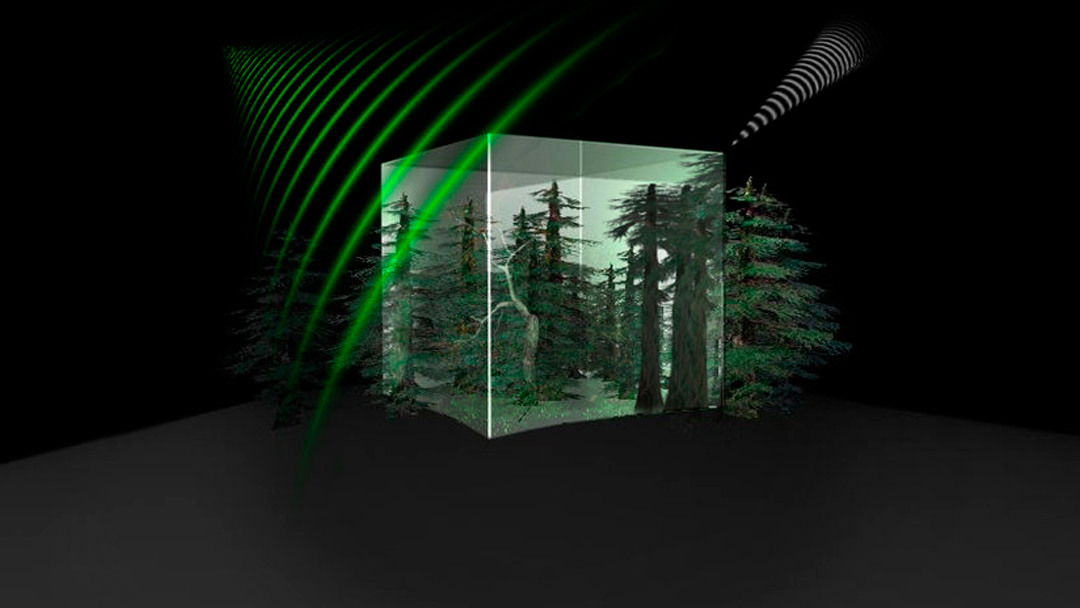
© ESA
Not everyone fond of nature or mountains loves snow. Those who plan the first spring hike want to see the eagerly awaited green and first blossoms, and do not want to walk through grey snow residues. But where are the blossoms?
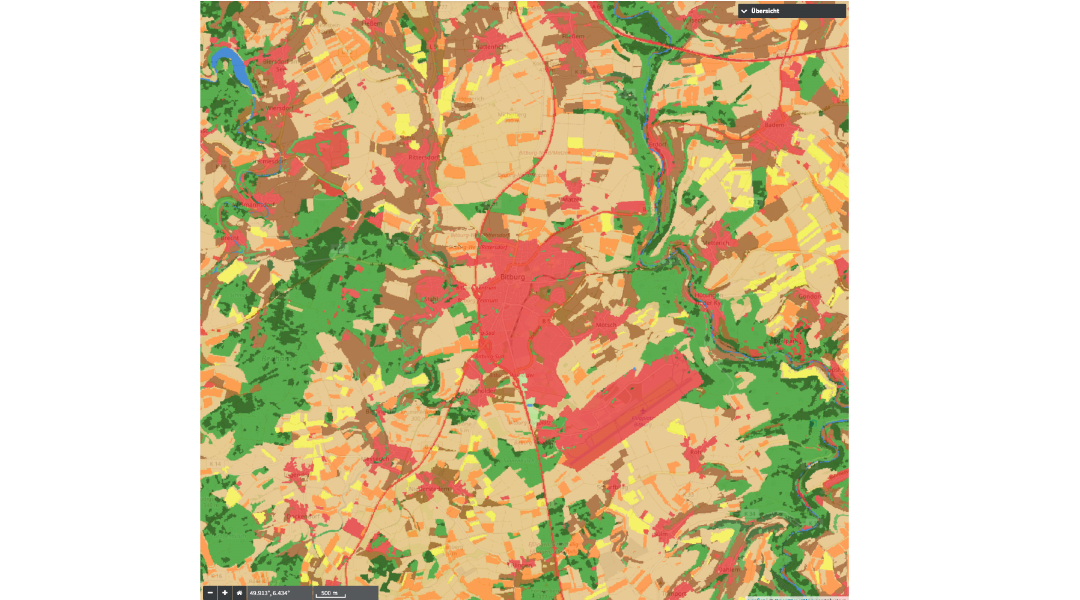
Spring can be detected from space. The catchword: net primary production. Satellite images show where and how much biomass was generated, i.e., how many leafs, buds, blossoms, and grasses have grown. Presently possibilities are created for consistent monitoring of biomass. This will help farmers to predict the yield from their fields more precisely and to avoid under- and overfertilisation.
The German Remote Sensing Data Center (DFD) of the DLR uses so-called vegetation models, i.e., methods that detect plant growth from space precisely – since the data has been previously compared to the results of field experiments.
© DLR
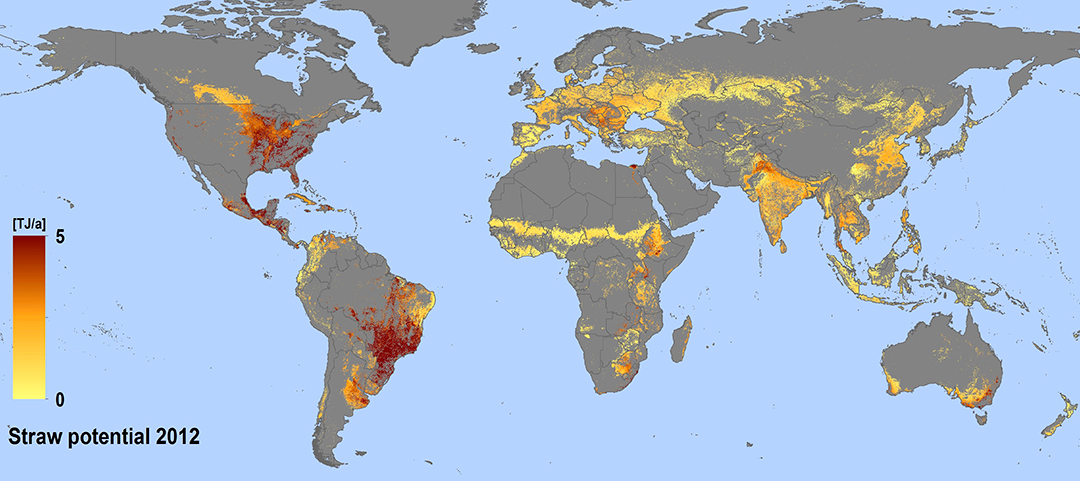
This technology also enables striking insights: DFD scientists have calculated whether unused straw waste could be an interesting source of renewable energies. By means of the map for global “straw potential” drawn up by the DLR, it was rendered possible to detect the worldwide distribution and availability of energy from straw biomass. For the exemplary year of 2012, a global straw potential of about 55 million terajoules has been calculated. Theoretically, this would be sufficient for Germany to cover its entire primary energy requirements over a period of four years (or for the USA over half a year).